For a decision-maker, time is the scarcest resource. When faced with a probabilistic budget or a risk register, reviewing hundreds of variables is simply unfeasible.
This is where the Tornado Diagram becomes the most powerful governance tool: it is the ultimate filter that separates the "noise" from the true threats and opportunities facing the business.
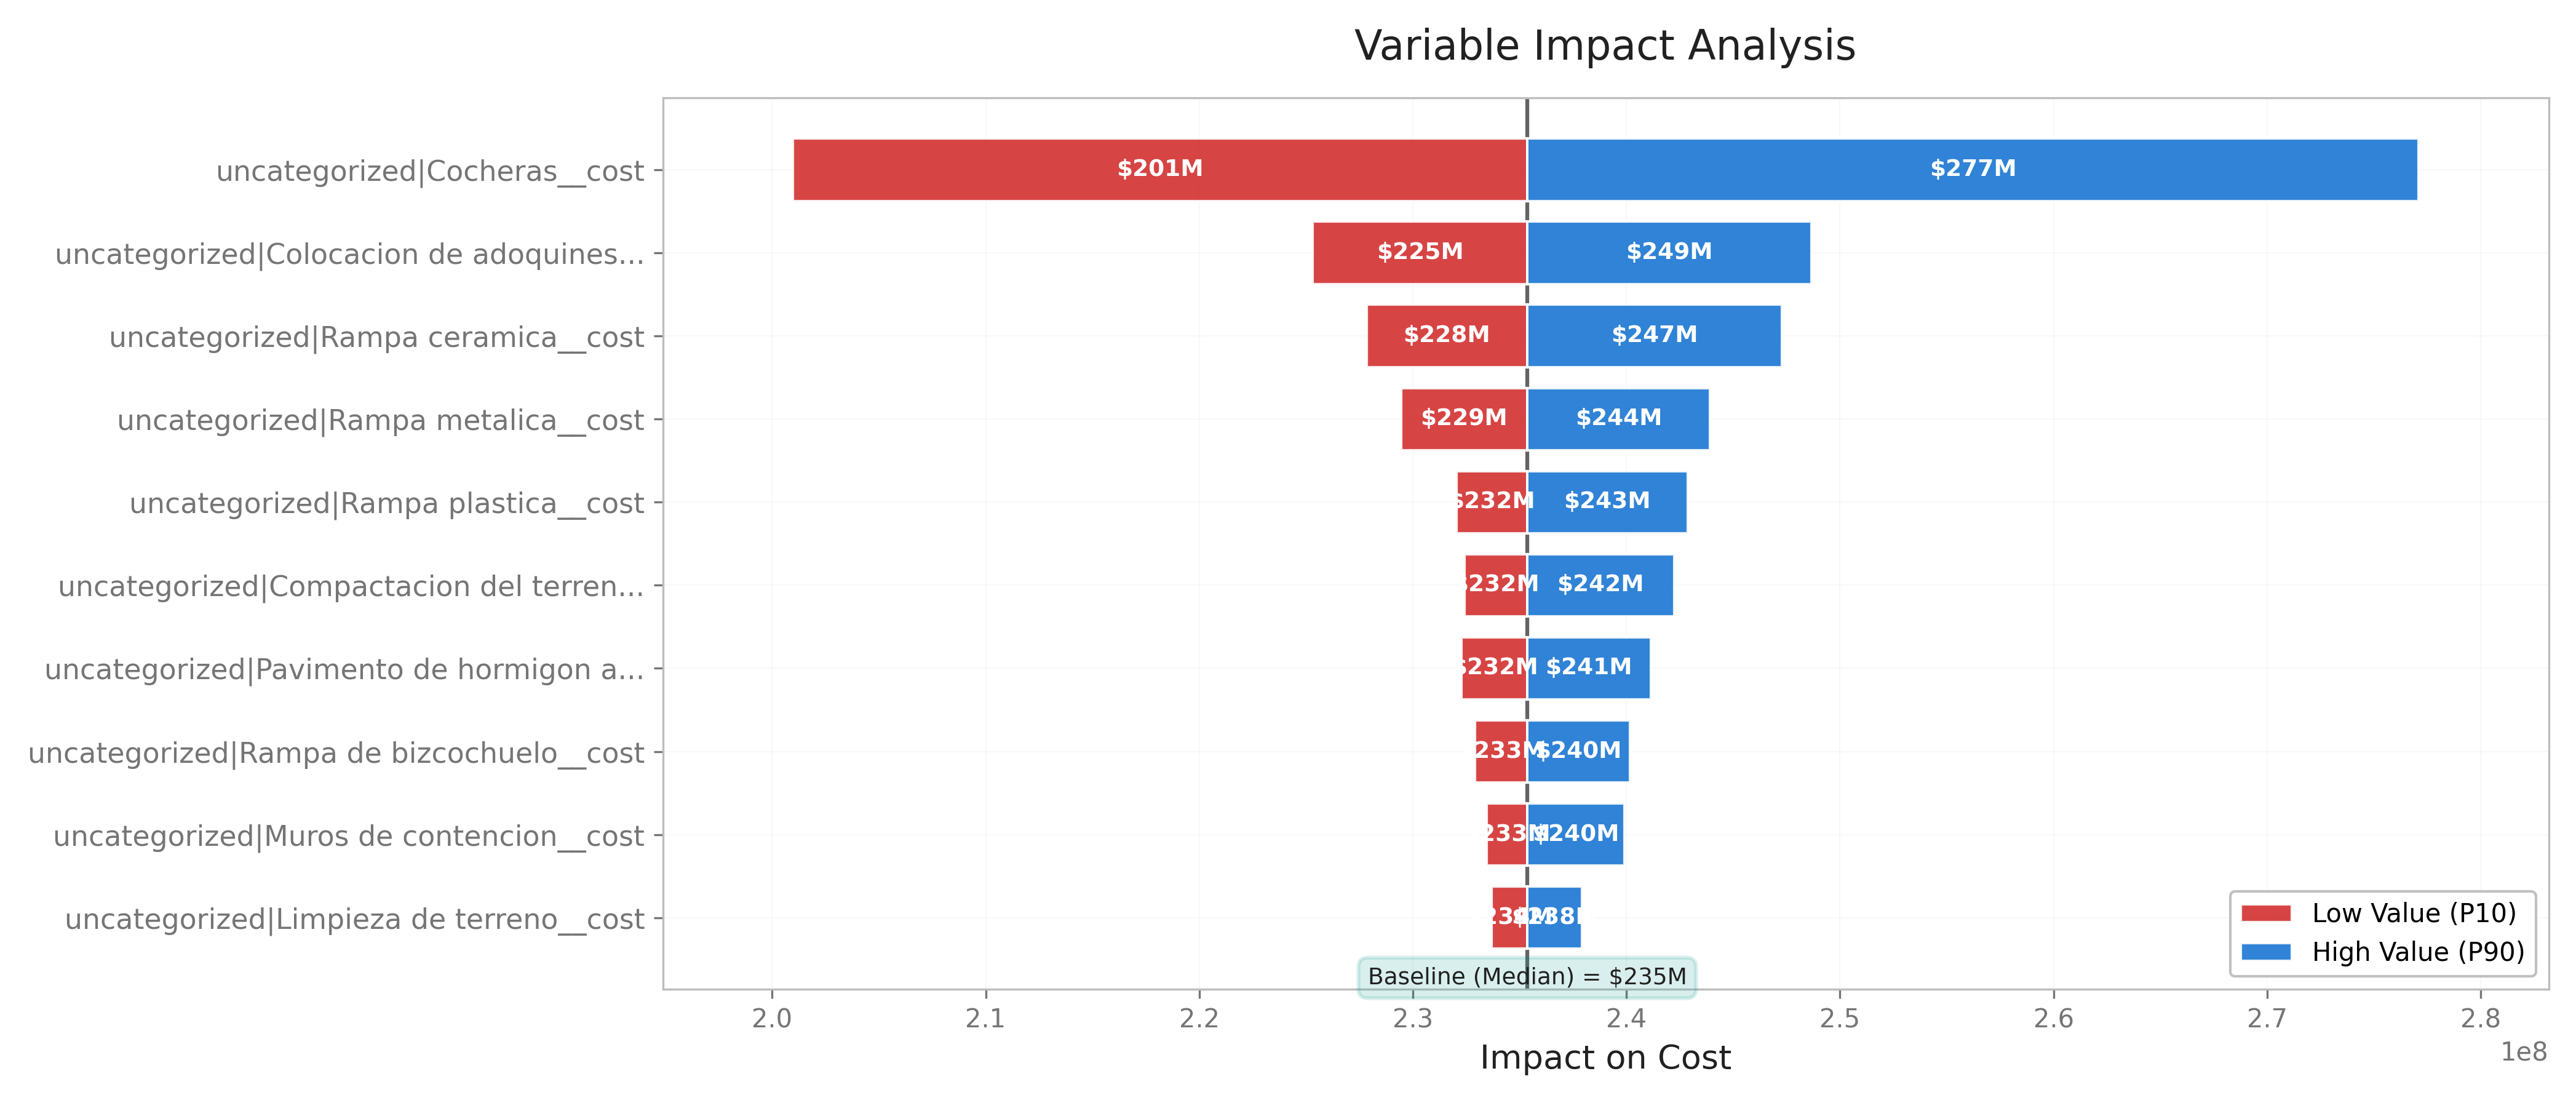
🌪️ What is a Tornado Diagram?
A tornado diagram is a graphical representation of a sensitivity analysis. Its shape (with the longest bars at the top and the shortest at the bottom) resembles a funnel or a tornado.
Its strategic value lies in how it answers the most crucial question an executive must ask:
"If everything changes at the same time, what are the 3 or 4 specific variables that can actually destroy my budget or project viability?"
In traditional planning, equal attention is often paid to all risks.
The tornado diagram eliminates this mistake by applying a visual Pareto principle: it instantly identifies which factors have the most devastating impact (or the greatest savings potential) if they deviate from the original plan.
📈 How to Interpret It in 10 Seconds?
Looking at a tornado diagram doesn't require advanced mathematical knowledge; it requires a strategic focus:
| The central axis | Represents the base value of your budget or the most likely scenario. |
| The length of the bars | The longer the bar, the greater the project's sensitivity to that variable. The top bars are the ones that "move the needle." |
| The color of the ends (Directional Sensitivity) | Typically, the left side shows the worst-case scenario (maximum loss/expense) and the right side shows the best-case scenario (maximum savings/gain) if that variable shifts to its historical or simulated limits. |
Fundamentally, the items with the longest bars are those that affect the project the most when their values change.
In other words, if I have to choose which items to allocate resources to during the project—for example, making an advance payment to lock in a price—I will choose the ones with the longest bars.
💼 Practical Application Cases
Case 1: Probabilistic Budget for a CAPEX Project (Energy)
Imagine the company is approving a $100 million investment for a new plant. The technical team presents a simulated probabilistic budget using @RISK or Faina. The tornado reveals the following:
| Bar 1 (Top - Giant) | Structural Steel Price. If the price rises to the worst-case scenario, the total project budget skyrockets to $118 million. If it drops, it falls to $95 million. |
| Bar 15 (Bottom - Tiny) | Painting Labor Cost. Its maximum variation barely alters the budget by $50,000. |
Executive Decision:
Case 2: Risk Register for a Product Launch (Technology)
You are evaluating the risk register for the global launch of a software platform. Instead of a boring list of 50 risks in Excel, the tornado diagram consolidates the financial impacts:
| Top Bar (Critical Risk) | Delay in EU regulatory certification. It shows that each month of delay shifts the revenue bar 25% to the left (losses). |
| Middle Bar | Minor cyberattack on test servers. The financial impact is moderate and absorbable. |
Executive Decision:
🏆 Business Value: From Intuition to Certainty
For decision-makers, the tornado diagram offers three non-negotiable benefits:
| Optimized Management Focus | Prevents analysis paralysis. It tells you exactly which phone calls and committees you need to get personally involved in this week. |
| Boardroom Justification | When presenting the probabilistic budget to shareholders, a tornado diagram demonstrates that the team didn't just add up numbers, but stress-tested the model against market volatility. |
| Efficient Contingency Reserve Allocation | Don't assign a 10% contingency "by intuition" across the entire budget. Allocate real, specific contingency to the 3 variables leading the tornado. |
Try Faina — Upgrade Your Risk Register →